Lifetime Access Opportunity
Create Your Own Algorithmic Trading Strategy Without Coding
Design your buy-sell rules on TradingView in seconds. Backtest your strategy to see historical performance, verify profitability.
Instantly execute automate trades via direct broker integration.
✅ Automated Trading 🔒 Direct Execution 🚀 TradingView Integration
10.000+
Strategies Tested
3000+
Active Traders
100%
TradingView Compatible
24/7
Market Monitoring
Test the Past Before Risking Your Cash
See exactly how much your strategy would have earned in the past, its success rate, and maximum drawdown in seconds. Don't waste time and money on failing strategies.
Only automate the winning formulas.

Unlimited Strategies in One Indicator
Moving Averages (MA), RSI, MACD, Bollinger Bands, and many more... Manage dozens of technical indicators from a single panel. Combine the conditions you want using a simple "Click-and-Select" method.
Even when your computer is off, your strategy continues to run 24/7 via TradingView alerts.
Show Moving Average Plots
MA Type
MA#1 Length (Longer)
MA#2 Length (Shorter)
Buy MA#2 > MA#1 Long Exit MA#2 Less Than MA#1
Sell MA#2 Less Than MA#1 Short Exit MA#2 > MA#1
Show Moving Average Plot
MA Type
MA Length
Buy Price > MA Long Exit Price > MA
Buy Price Less Than MA Long Exit Price Less Than MA
Sell Price > MA Short Exit Price > MA
Sell Price Less Than MA Sell Exit Price Less Than MA
Buy Any of Last 5 Candle Less Than MA
Sell Any of Last 5 Candle > MA
Show Moving Average Plot
MA Type
MA Length
Buy Price > MA Long Exit Price > MA
Buy Price Less Than MA Long Exit Price Less Than MA
Sell Price > MA Short Exit Price > MA
Sell Price Less Than MA Short Exit Price Less Than MA
Buy Any of Last 5 Candle Less Than MA
Sell Any of Last 5 Candle > MA
Percent
Activate Buy Condition Activate Long Exit Condition
Activate Sell Condition Activate Short Exit Condition
Lookback
Overbought
Oversold
Buy RSI Less Than Oversold Long Exit RSI > Overbought
Sell RSI > Overbought Short Exit RSI Less Than Oversold
Buy RSI > Oversold Long Exit RSI Less Than Overbought
Sell RSI Less Than Overbought Short Exit RSI > Oversold
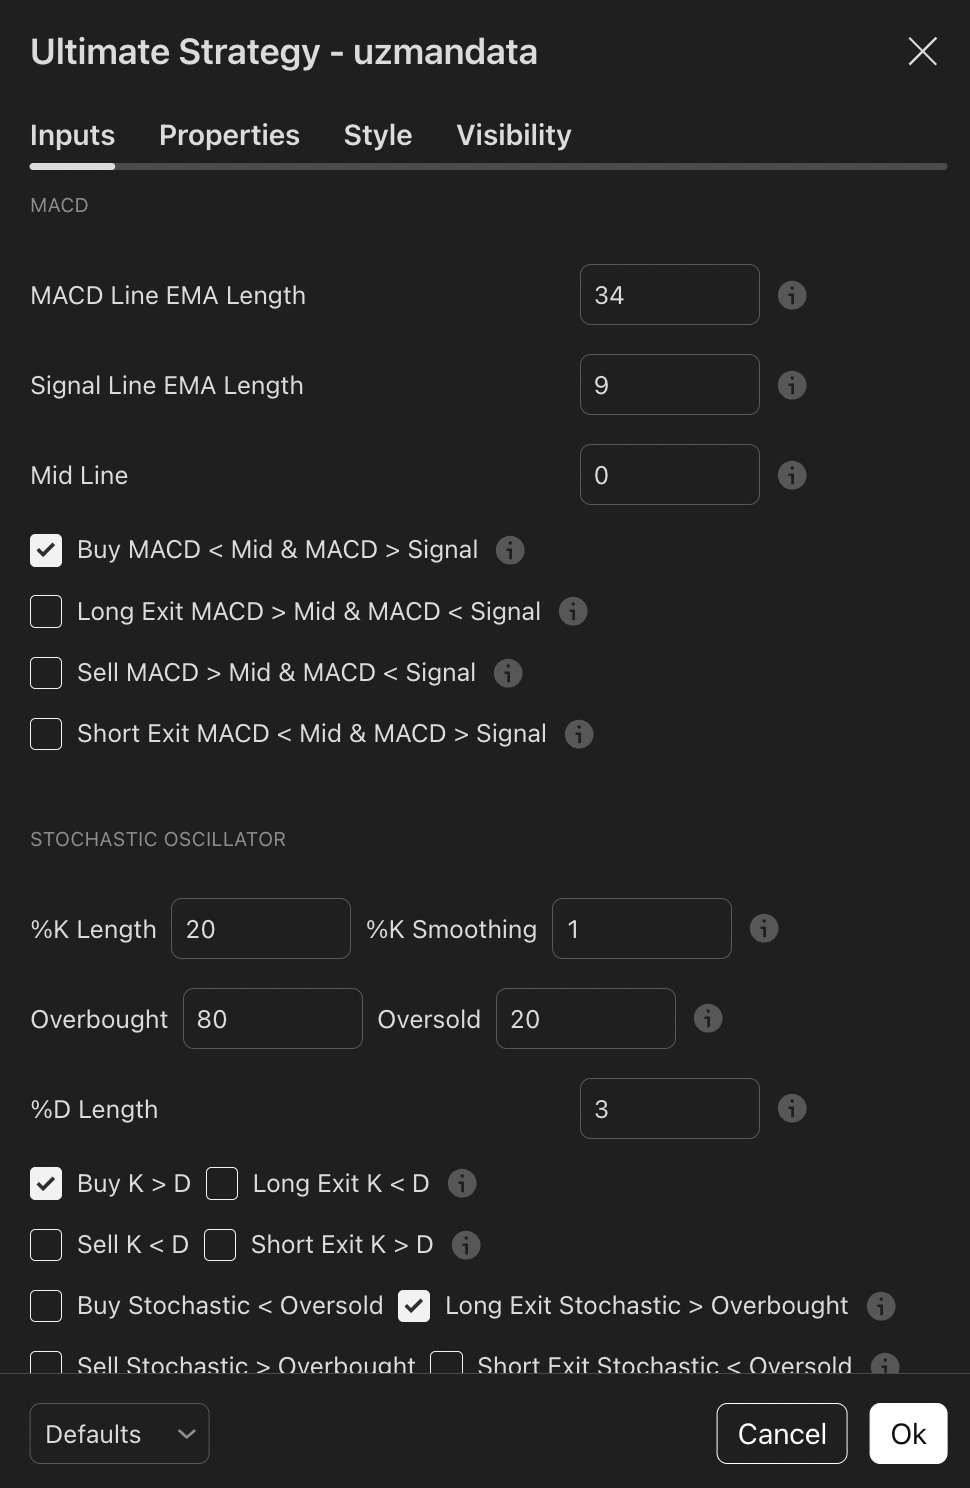
MACD Line EMA Length
Signal Line EMA Length
Mid Line
Buy MACD Less Than Mid & MACD> Signal
Long Exit MACD > Mid & MACD Less Than Signal
Sell MACD > Mid & MACD Less Than Signal
Short Exit MACD Less Than Mid & MACD > Signal
%K Length
%K Smoothing
%D Length
Overbought
Oversold
Buy K > D Long Exit K Less Than D
Sell K Less Than D Short Exit K > D
Buy Stochastic Less Than Oversold Long Exit Stochastic > Overbought
Sell Stochastic > Overbought Short Exit Stochastic Less Than Oversold
Show Bollinger Line and Bands
Source
Length
Offset
Band Multiplier
Prev. Bar Count
Buy Price Less Than Baseline Long Exit Price > Baseline
Sell Price > Baseline Short Exit Price Less Than Baseline
Buy Price > Baseline Long Exit Price Less Than Baseline
Sell Price Less Than Baseline Short Exit Price > Baseline
Source
Length
Dev
Buy Price Less Than Lowerline Long Exit Price > Upperline
Sell Price > Upperline Short Exit Price Less Than Lowerline
Show Ichimoku Line and Bands
Conversion Line (Tenkan Sen) Length
Base Line (Kijun Sen) Length
Leading (Senkou) Span B Length
Lagging (Chiko Sen) Span
Buy Price > Tenkan Sen Long Exit Price Less Than Tenkan Sen
Sell Price > Tenkan Sen Short Exit Price Less Than Tenkan Sen
Buy Price > Kijun Sen Long Exit Price Less Than Kijun Sen
Sell Price > Kijun Sen Short Exit Price Less Than Kijun Sen
Buy Tenkan Sen > Kijun Sen Long Exit Tenkan Sen Less Than Kijun Sen
Sell Price > Tenkan Sen Short Exit Price Less Than Tenkan Sen
Buy Senkou Span A > Span B Long Exit Senkou Span A Less Than Span B
Sell Senkou Span A > Span B Short Exit Senkou Span A Less Than Span B
Buy Price > Kumo Long Exit Price Less Than Kumo
Sell Price > Kumo Short Exit Price Less Than Kumo
Buy Price > Chiko Span Long Exit Price Less Than Chiko Span
Sell Price > Chiko Span Short Exit Price Less Than Chiko Span
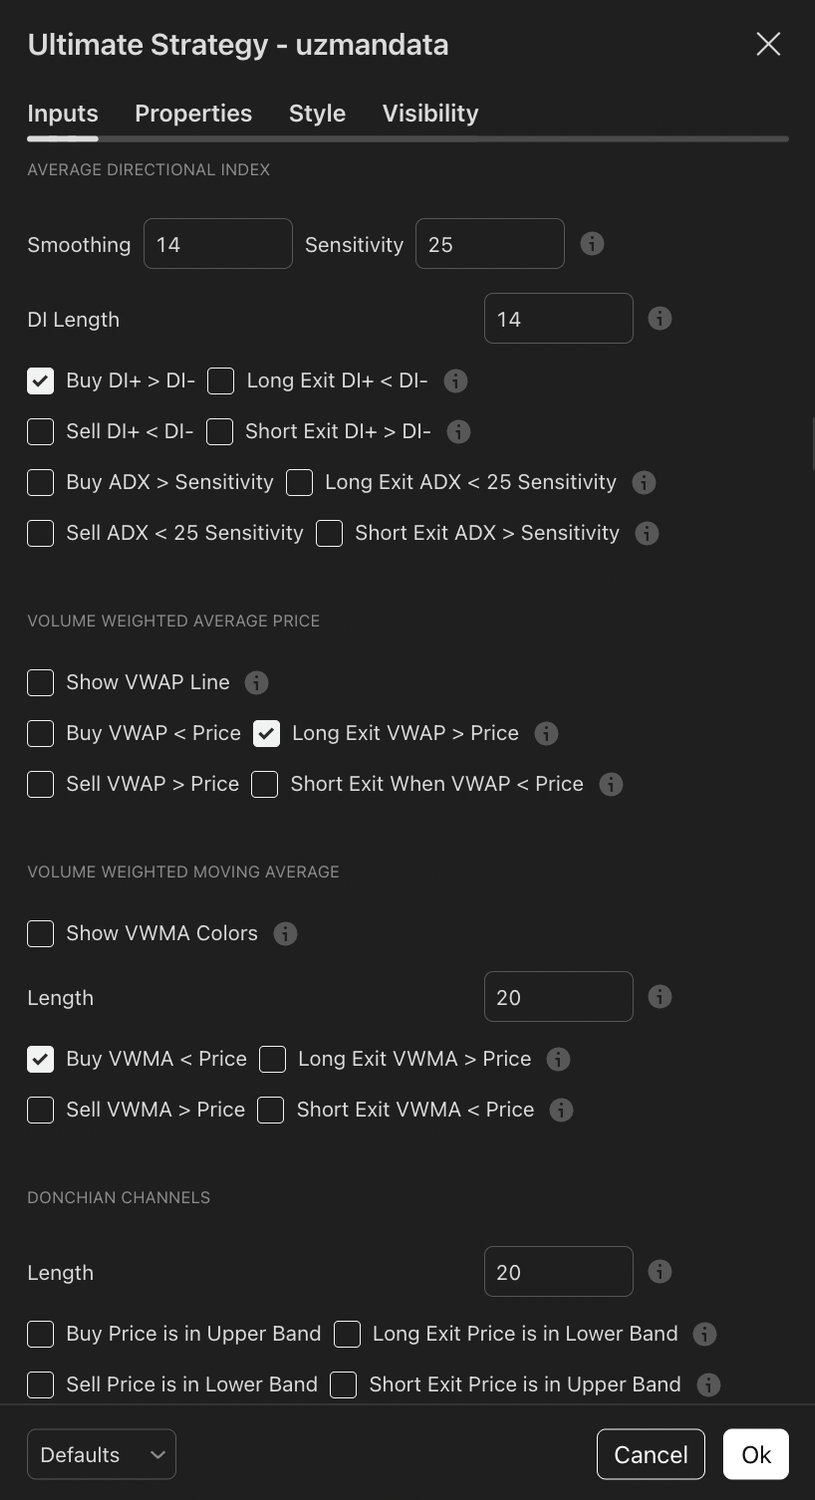
ADX Smoothing
DI Length
ADX Sensitivity
Buy DI+ > DI- Long Exit DI+ Less Than DI-
Sell DI+ Less Than DI- Short Exit DI+ > DI-
Buy ADX > Sensitivity Long Exit ADX Less Than 25 Sensitivity
Sell ADX Less Than 25 Sensitivity Short Exit ADX > Sensitivity
Show VWAP Line
Buy VWAP Less Than Price Long Exit VWAP > Price
Sell VWAP > Price Short Exit VWAP Less Than Price
Show VWMA Colors
Buy VWMA Less Than Price Long Exit VWMA > Price
Sell VWMA > Price Short Exit VWMA Less Than Price
Show Donchian Bands
Length
Buy Price is in Upper Band Long Exit Price is in Lower Band
Sell Price is in Lower Band Short Exit Price is in Upper Band
BB Length
BB MultiFactor
KC Length
KC MultiFactor
V2 MA Signal Period
Buy Momentum = Green Long Exit Momentum = Red
Sell Momentum = Red Short Exit Momentum = Green
Buy Momentum > MA Long Exit Momentum Less Than MA
Sell Momentum Less Than MA Short Exit Momentum > MA
Show SuperTrend Plots
ATR Periods
Source
ATR Multiplier
Buy Trend = Green Long Exit Trend = Red
Sell Trend = Red Short Exit Trend = Green
Show SuperTrend Plots
ATR Periods
Source
ATR Multiplier
Buy Trend = Green Long Exit Trend = Red
Sell Trend = Red Short Exit Trend = Green
Multiplier
Common Period
Source
No Volume Data?
Activate Buy Condition Activate Long Exit Condition
Activate Sell Condition Activate Short Exit Condition
Source
Period
Percent
MA Type
Activate Buy Condition Activate Long Exit Condition
Activate Sell Condition Activate Short Exit Condition
Show MavilimW Colors
First Moving Average
Second Moving Average
Buy MavilimW = Blue Long Exit MavilimW = Red
Sell MavilimW = Red Short Exit MavilimW = Blue
T3 Length
Volume Factor
T3 Length Fibo
Volume Factor Fibo
Activate Buy Condition Activate Long Exit Condition
Activate Sell Condition Activate Short Exit Condition
Source
Fast Period
Fast Range
Slow Period
Slow Range
Activate Buy Condition Activate Long Exit Condition
Activate Sell Condition Activate Short Exit Condition
Length
Signal Length
Source
Overbought Level
Oversold Level
Buy MFI in Rising Trend Long Exit MFI in Falling Trend
Sell MFI in Falling Trend Short Exit MFI in Rising Trend
Buy MFI Less Than Oversold Long Exit MFI > Overbought
Sell MFI > Overbought Short Exit MFI Less Than Oversold
Show Kaufman Colors
Length
Fast Length
Slow Length
Source
Buy Kaufman = Green Long Exit Kaufman = Red
Sell Kaufman = Red Short Exit Kaufman = Green
CCI Length
CCI Source
MA Type
MA Length
Overbought
Oversold
Buy CCI Less Than Oversold Long Exit CCI Higher Than Overbought
Sell CCI Higher Than Overbought Short Exit Less Than Oversold
Buy CCI Less Than Overbought Long Exit CCI Higher Than Oversold
Sell CCI Higher Than Oversold Short Exit Less Than Overbought
Buy CCI Higher Than MA Long Exit CCI Less Than MA
Sell CCI Less Than MA Short Exit Higher Than MA
Length
Activate Buy Condition Activate Long Exit Condition
Activate Sell Condition Activate Short Exit Condition
Channel Length
Average Length
Buy Wave 1 > Wave 2 Long Exit Wave 1 Less Than Wave 2
Sell Wave 1 Less Than Wave 2 Short Exit Wave 1 > Wave 2
Highs Source
Lows Source
Max Range
Noise Reduction
Buy on Support Long Exit on Resistence
Sell on Resistence Short Exit on Support
Length
Buy RVI in Rising Trend Long Exit RVI in Falling Trend
Sell RVI in Falling Trend Short Exit RVI in Rising Trend
Long Entry Long Exit
Short Entry Short Exit
Activate Buy Condition Activate Long Exit Condition
Activate Sell Condition Activate Short Exit Condition
#1 Candle Count
#1 Candle Color
#1 Percent Change %
#1 Activate Buy Condition #1 Activate Long Exit Condition
#1 Activate Sell Condition #1 Activate Short Exit Condition
#1 Activate Buy Higher High #1 Activate Long Exit Lower Low
#1 Activate Sell Lower Low #1 Activate Short Exit Lower Low
#2 Candle Count
#2 Candle Color
#2 Percent Change %
#2 Activate Buy Condition #2 Activate Long Exit Condition
#2 Activate Sell Condition #2 Activate Short Exit Condition
#2 Activate Buy Higher High #2 Activate Long Exit Lower Low
#2 Activate Sell Lower Low #2 Activate Short Exit Lower Low
Show Min Max Bands
Show Bar Volatility
Show Volatility Table
Show Max Drawdown
Candle Count for MinMax Bands
Long %
Short %
Candle Change High Value %
Candle Change Low Value %
Candle Count for Max Drawdown
Buy MinBand Condition Sell MinBand Condition
Buy MaxBand Condition Sell MaxBand Condition
Long Exit MinBand Condition Long Exit MaxBand Condition
Short Exit MinBand Condition Short Exit MaxBand Condition
Activate NASDAQ Correlation
NASDAQ Daily Price Changes %
Activate BITO Correlation
BITO Daily Price Changes
Buy Daily Candle = Green Long Exit Daily Candle = Red
Sell Daily Candle = Red Short Exit Daily Candle = Green
Futures Entry Date
Futures Exit Date
Exact Date?
Futures Buy = Entry Date Futures Long Exit = Exit Date
Futures Sell = Entry Date Futures Short Exit = Exit Date
Activate Base Entity
Base Entity
Base Percent Change %
Base Price Change Type %
Activate Graphic Entity
Graphic Percent Change %
Graphic Price Change Type %
Entry Time
Exit Time
Buy Entry Daily Time Long Exit Daily Time
Sell Entry Daily Time Short Exit Daily Time
Scheduled Long Profit %
Scheduled Short Proft %
Squeeze Momentum Volatility Booster
Use Bullish Engulfing Candles (For Buy)
Use Bearish Engulfing Candles (For Long Exit)
Use Bearish Engulfing Candles (For Sell)
Use Bullish Engulfing Candles (For Short Exit)
Use Swing Low Candles (For Buy)
Use Swing High Candles (For Long Exit)
Use Swing High Candles (For Sell)
Use Swing Low Candles (For Short Exit)
Pyramiding %
Conditional Pyramiding
1st MA Pyramiding
2nd MA Pyramiding
3rd MA Pyramiding
4th MA Pyramiding
5th MA Pyramiding
Pyramiding %
Conditional Pyramiding
1st MA Pyramiding
2nd MA Pyramiding
3rd MA Pyramiding
4th MA Pyramiding
5th MA Pyramiding
Activate Manual Long Take Profit %
Long Take Profit %
Activate Manual Long Stop Loss %
Long Stop Loss %
Activate Indicator Long Stop Loss
Indicator Type
Activate Trailing Long Stop Loss %
Long Stop Loss %
Activate Progressive Long Take Profits
TP 1 % Contract1 %
TP 2 % Contract2 %
TP 3 % Contract3 %
TP 4 % Contract3 %
Activate Manual Short Take Profit %
Short Take Profit %
Activate Manual Short Stop Loss %
Short Stop Loss %
Activate Indicator Short Stop Loss
Indicator Type
Activate Trailing Short Stop Loss %
Short Stop Loss %
Activate Progressive Short Take Profits
TP 1 % Contract1 %
TP 2 % Contract2 %
TP 3 % Contract3 %
TP 4 % Contract3 %
Activate ATR Trailing Stop
ATR Length
Use ATR Structure
How far to look back for high/lows?
ATR Multiplier
Low Price
High Price
Grid Level Count
Grid Stop Price
Activate Long Grid
Activate Stop Grid
Investment Frequency
Activate Algo Investing
Activate Backtesting
Block Before Time
Block Buy Before Time Block Long Exit Before Time
Block Sell Before Time Block Short Exit Before Time
Block After Time
Block Buy After Time Block Long Exit After Time
Block Sell After Time Block Short Exit After Time
Long Entry Alert Signal
Long Entry Pyramiding Alert Signal
Long Exit Alert Signal
Short Entry Alert Signal
Short Entry Pyramiding Alert Signal
Short Exit Alert Signal
Start Date
End Date
Why Do Thousands of Traders Choose Uzmandata?
Leave the stress of manual trading behind.
Here are the features that will change your trading life:

Extensive Indicator Library
RSI, MACD, SuperTrend, and more. Professional indicators are waiting to be part of your strategy.

24/7 Market Monitoring
No need to keep your computer on. Your strategy runs 24/7 via TradingView Server-Side Alerts while you sleep or travel.

First Test, Then Invest
See the historical performance of your strategy before risking real money. Backtest unlimited times.

Zero Coding, 100% Control
No need to know Python or Pine Script. Build complex algorithms just by checking boxes.

Seamless TradingView Integration
Run your strategies smoothly with real-time data on the world's most popular charting platform.

1-on-1 Expert Support
You are not alone. Our technical team is ready to assist you with setup and technical configuration.
One Package, Unlimited Access
Get both the Strategy Indicator and the Automated Trading Integration in a single package. Join now and lock in all future updates at no extra cost.
$1997
everyday price

$997
/ One-Time
Pay once, use forever.
Ultimate Strategy Indicator (Unlimited Backtest)
Automated Trading Compatibility (Crypto & Stocks)
TradingView Alarm Integration
24/7 Execution via TradingView
Priority Support & Free Updates
🔒 256-Bit SSL Secure Payment

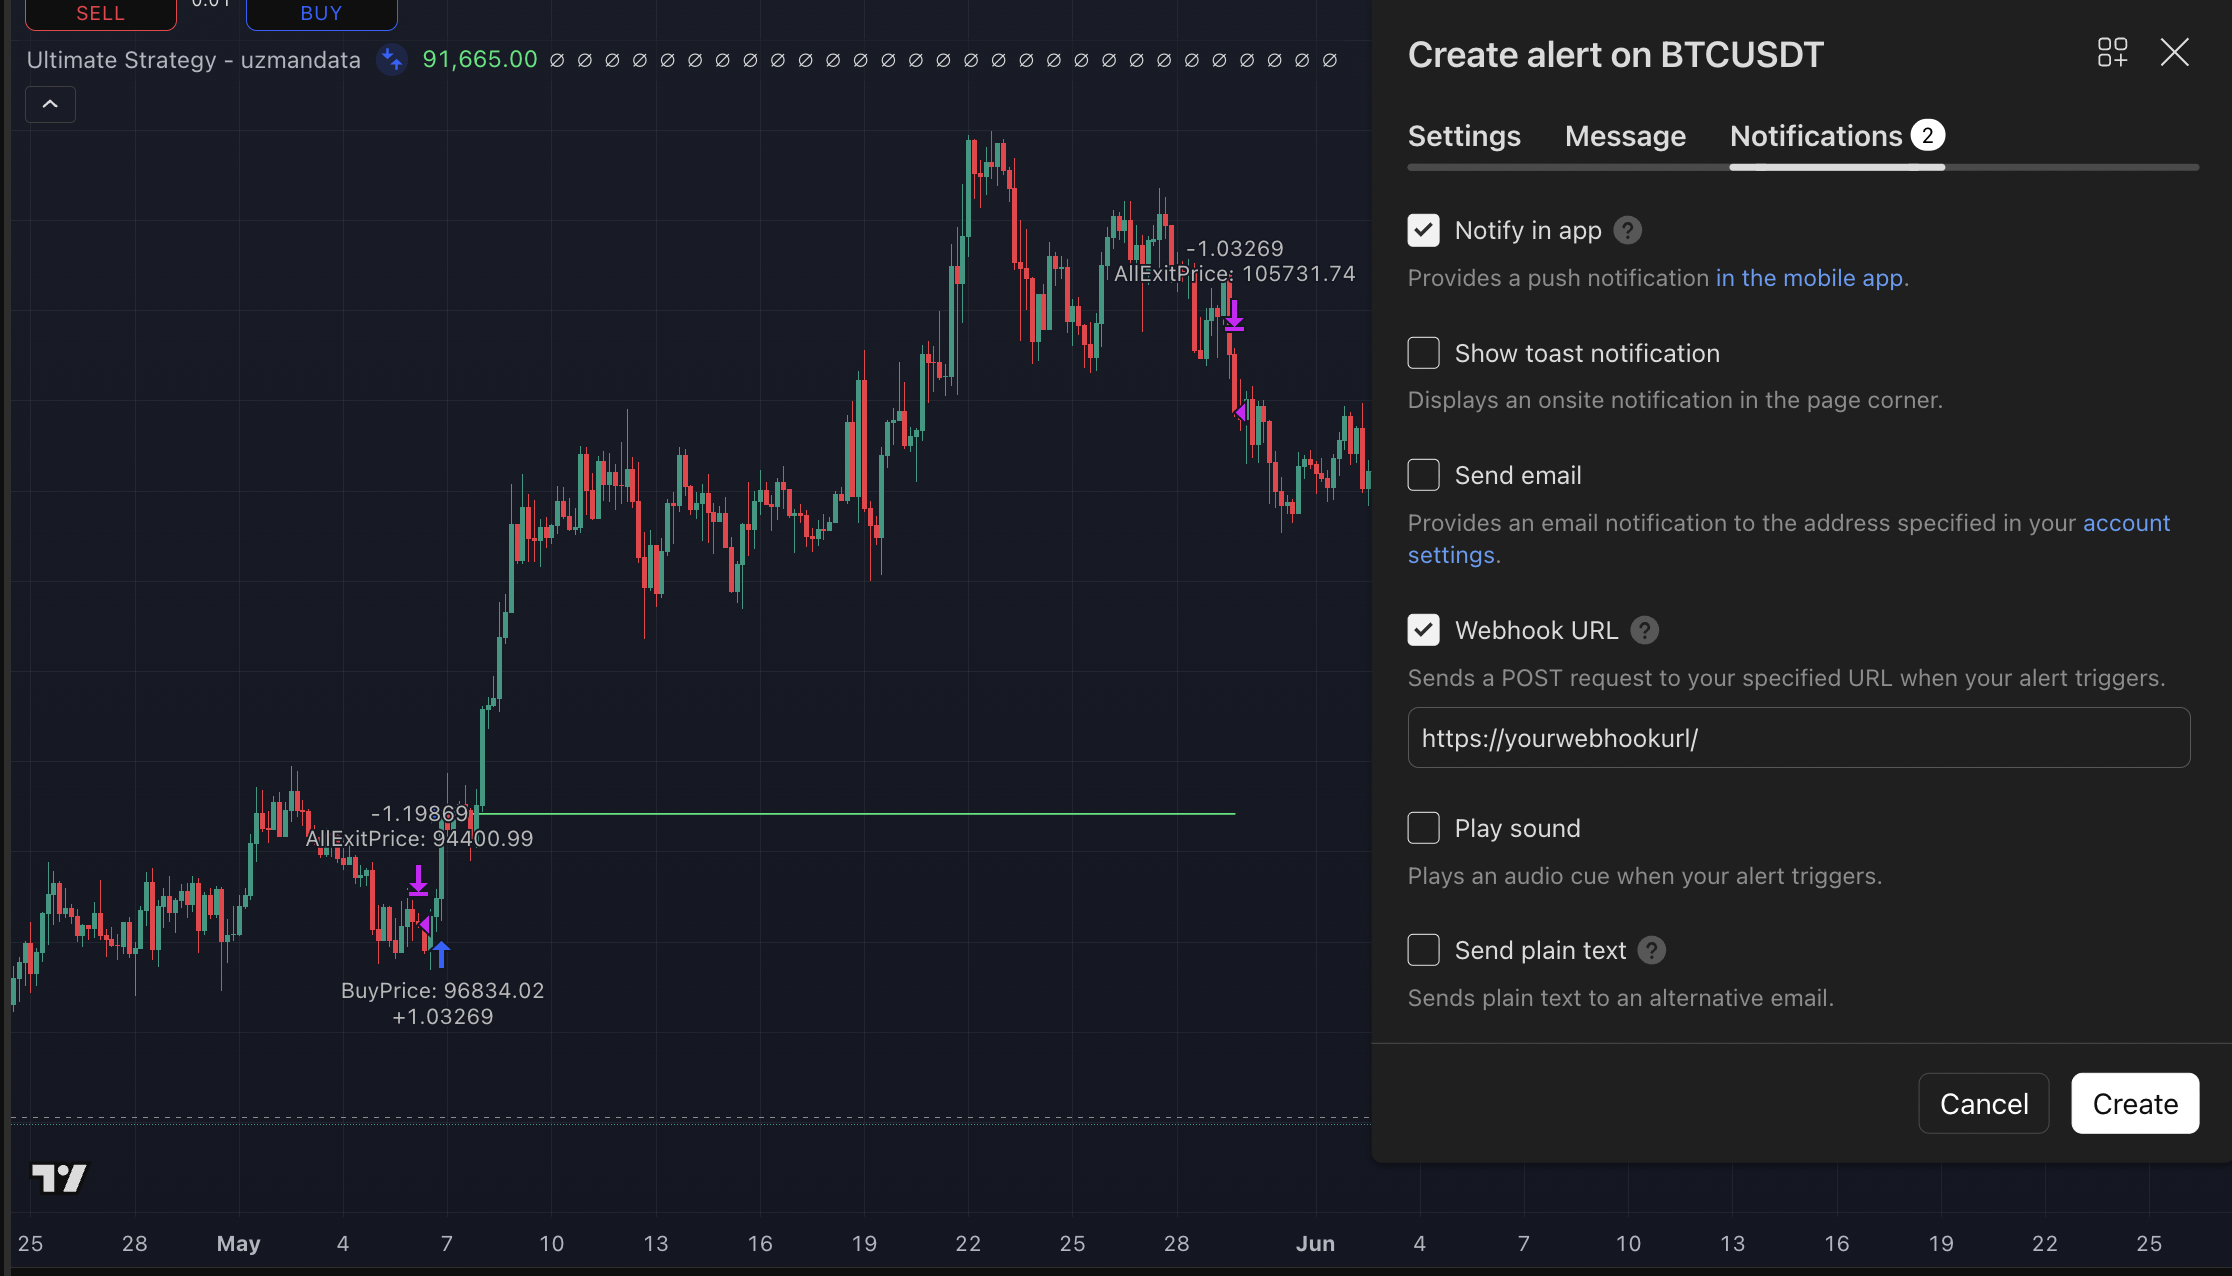
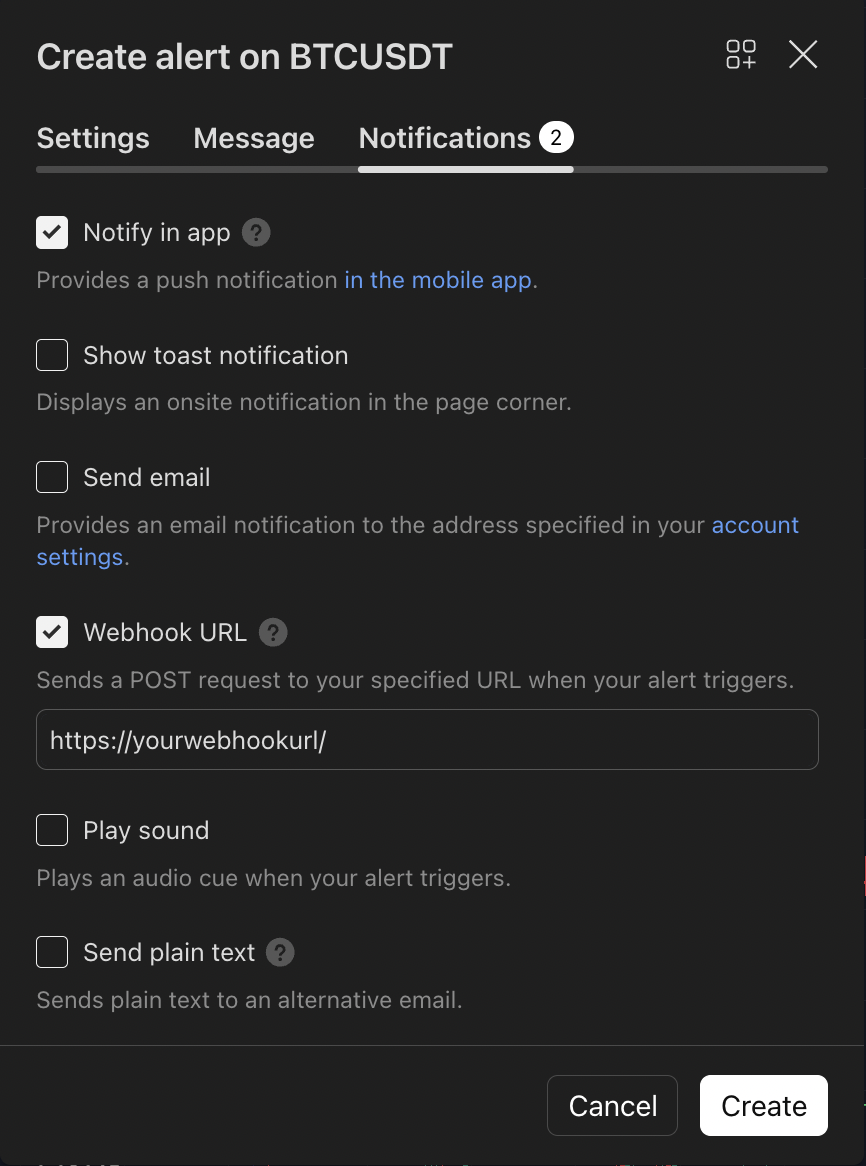
Turn TradingView Signals into Real Orders
Set up your strategy, copy your unique Webhook URL into the TradingView alert box. That's it!
The moment a signal is generated, your order is transmitted directly to your exchange account via TradingView integration. While you go on with your life, your system stands guard 24/7 in Crypto and Stock markets.
Audit Every Single Trade
Go beyond the charts. Review a transparent list of exactly when and at what price your strategy executed trades.
Verify all entry and exit points and leave no room for surprises.

Get Opportunities as Notifications
Stop staring at the screen. Get an instant Notification the moment your strategy generates a signal. Never miss a market move.
Combine Indicators, Create Your Own Signal
MACD, RSI, or Stochastic... Connect different indicators to each other.
Instead of writing complex code lines, simply check the boxes on the panel to define your conditions. Build your strategy in seconds, just like assembling building blocks.
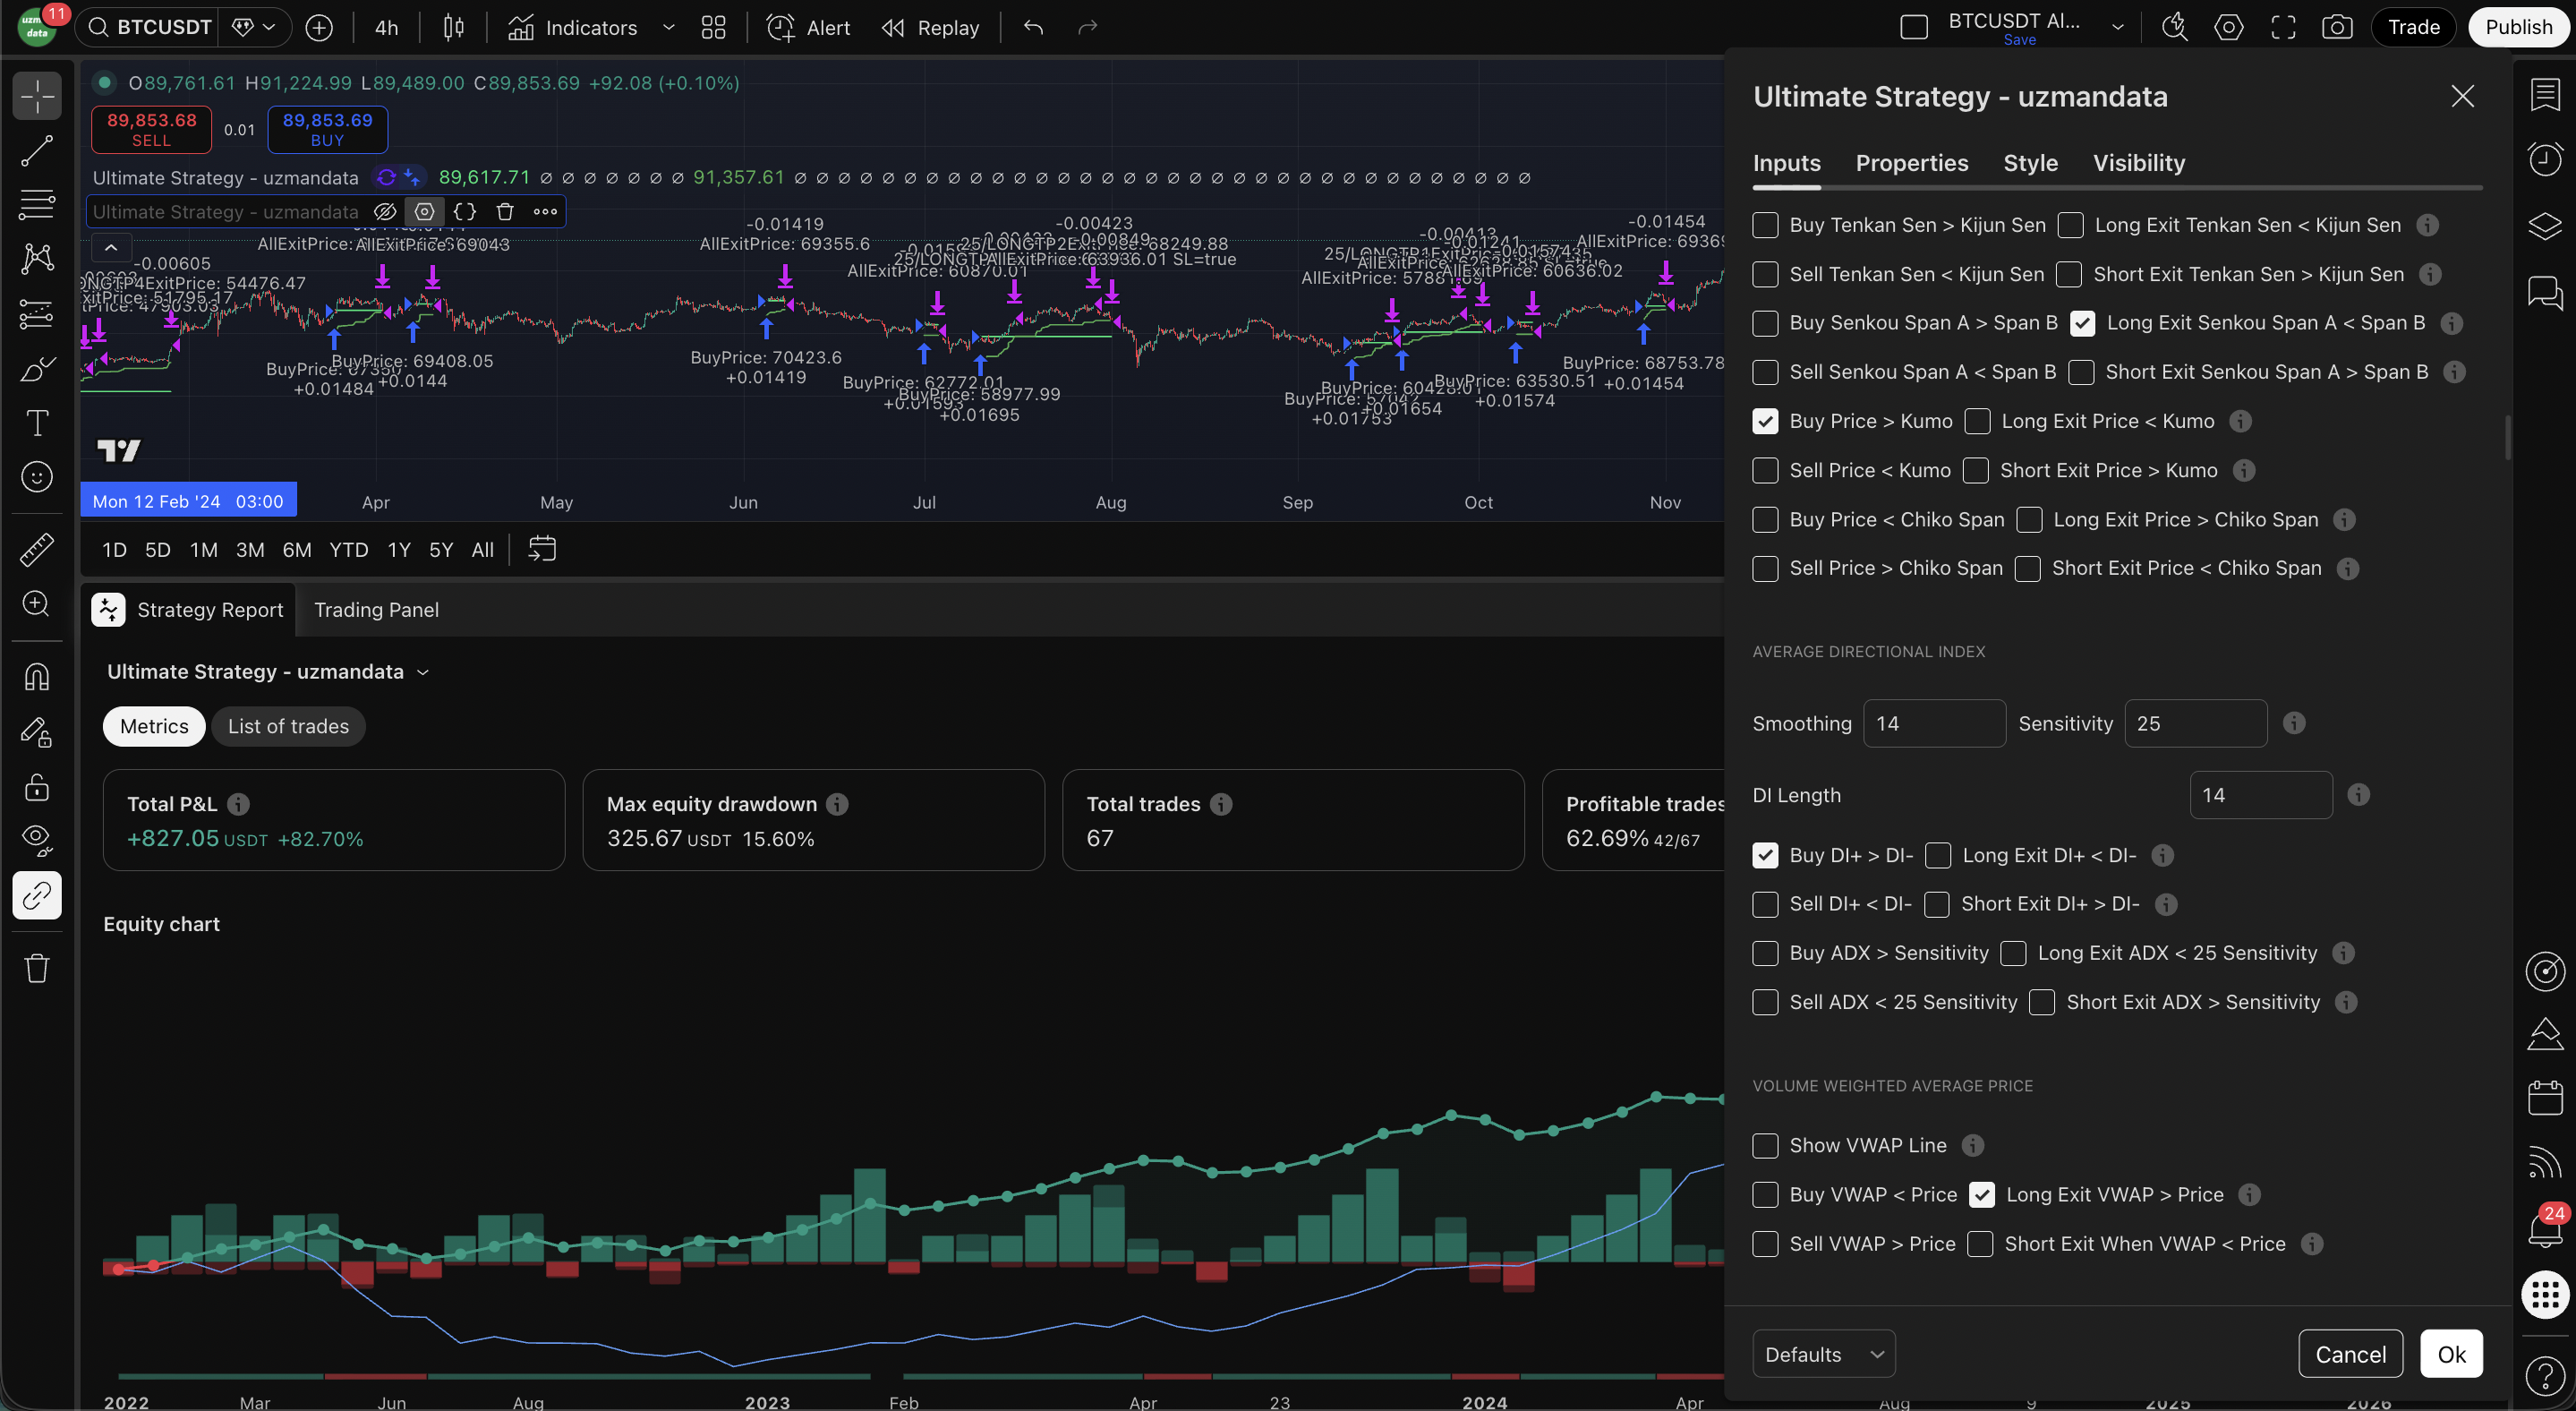
Stop Guessing: Real-Time Profitability Analysis
Watch the chart and profitability rate change live as you tweak your strategy settings.
Discover which parameters make money and which ones lose money before risking a single penny.
Frequently Asked Questions
When you purchase, the premium "Ultimate Strategy - Uzmandata" indicator is added to the TradingView -> Indicators -> Invitation-Only Access section.
You are registered to our training panel.
The strategy indicator works entirely on TradingView's free plan.
The strategy indicator is available on TradingView for stocks, crypto, forex, futures, and commodities such as 1min, 5min, 30min, 1hr, 4hr, 1day, etc. It works in all time frames including.
Indicators within the strategy indicator can fit any type of position (scalping, swing trading, investment, etc.) according to their algorithmic calculations to find the right trading points.
No way. There is no “indicator,” “algorithm,” “system,” or “strategy” that will give you the power to predict the markets with guaranteed accuracy.
Premium indicators cannot guarantee you profits or make you a better trader / investor on their own.
We do not recommend that you follow any indicator blindly. Trading is risky, most traders lose money and past performance does not guarantee future results.
The difference of the strategy indicator is that it prevents emotional behavior and enters into transactions by receiving buy or sell signals from more than one indicator.
You still choose which indicators you will get support from.
For now, our indicators only work on TradingView (a free web-based charting platform) and you can trade based on these charts in real-time on those charts.
Automate Your Trading Today
Leave the stress and emotional decisions behind. Trust the data, and let your automated strategy execute trades 24/7 with discipline.


Ⓒ 2026 Uzmandata LLC
Privacy, Cookies & Refund Policy | Terms of Service | Disclaimer
Uzmandata is not a brokerage. Financial datas provided by TradingView.